PostgreSQL HA in 2 Hours: How AI Agents Are Changing the game
The Ask: Production-grade HA without a DBA on payroll
Before: Single-node PostgreSQL. One kernel panic. 47 minutes of clickstream data—gone.
Now: 2-node streaming replication, automated failover, WireGuard tunnel to on-prem, 70+ chaos tests passed with zero data loss.
The Ask: Production-grade HA without a DBA on payroll
Not looking for “generate a pg_hba.conf” answers.
What I need is the equivalent of a senior DBA + SRE partner—someone who can audit my infrastructure, find the security holes I missed, reason through replication topologies, and help me build something that survives chaos.
The goal isn’t to copy-paste configs from Stack Overflow. It’s to build a production system I actually understand.
Phase 1: Infrastructure Discovery
Before: SSH into each server. Run htop. Run df -h. Copy output to a Google Doc. Forget which server had what. Repeat tomorrow.
Now: One command. Agent SSHs into all 4 servers, collects CPU governors, kernel modules, swap status, storage mounts, PostgreSQL configs, network latency matrix—outputs a structured report with RED/YELLOW/GREEN status.
Immediately, problems surfaced. My PostgreSQL was running with default shared_buffers (128MB on a 32GB machine). WAL archiving was off. max_wal_senders was set to 0—replication literally impossible.
10 minutes of discovery saved 3 hours of debugging.
Create /infra-audit command in your CLAUDE.md or put it into .claude
## /infra-audit
When I say /infra-audit [service], SSH into all registered servers and collect:
1. Hardware: CPU cores, RAM, disk (lsblk, df -h), RAID config
2. OS: kernel version, loaded modules, sysctl params
3. Service-specific: config files, running processes, port bindings
4. Network: latency matrix between all nodes (ping -c 10)
5. Security: open ports (ss -tlnp), firewall rules, exposed services
Output a structured report with:
- GREEN: Production-ready settings
- YELLOW: Suboptimal but functional
- RED: Blockers that must be fixed
Store server SSH configs in ~/.ssh/config and reference by hostname.
Phase 2: Security Audit
Before: “I’ll harden it before production.” Production ships. You forget. Six months later you’re on Hacker News for exposing customer data.
Now: Agent scans configs against CIS benchmarks, flags attack vectors, generates hardened configs AND explains what each fix prevents.
Every single one of these was a “I’ll fix it later” shortcut. Claude didn’t just flag them—it generated the remediation script and explained the attack vector each fix prevents.
The SSL setup alone would have taken me 2 hours. Certificate generation, postgresql.conf changes, pg_hba.conf enforcement, client connection string updates. Done in one pass.
Every single one of these was a “I’ll fix it later” shortcut I’d taken during initial setup. Claude didn’t just flag them—it generated the hardened configs and explained the attack vectors each one prevented.
Build Your Own: /security-scan
Create a /security-scan command:
/security-scan
When I say /security-scan [service], audit against common attack vectors:
- Network: Services bound to 0.0.0.0, open ports, firewall gaps
- Auth: Default creds, weak methods (trust/md5), missing SSL
- Secrets: Plaintext passwords in env vars, configs, shell history
- Logging: Audit trails enabled, failed auth tracking
For each finding: Severity + Attack Vector + Remediation + Verification command
Phase 3: Environment Optimization
Before: Google “postgresql recommended settings.” Find a 2019 blog post. Copy settings blindly. Hope they work for your workload.
Now: Agent asks about YOUR workload first. OLTP or OLAP? Write/read ratio? Connection patterns? Then recommends settings calibrated to your hardware AND your use case.
Current: shared_buffers = 128MB
Recommended: shared_buffers = 8GB (25% of RAM)
Impact: ~40% reduction in disk reads for repeated queries
Current: effective_cache_size = 4GB
Recommended: effective_cache_size = 24GB (75% of RAM)
Impact: Query planner makes better index decisions
Current: wal_buffers = -1 (auto: 4MB)
Recommended: wal_buffers = 64MB
Impact: Reduced WAL contention under write load
Current: checkpoint_completion_target = 0.5
Recommended: checkpoint_completion_target = 0.9
Impact: Spreads I/O, prevents checkpoint spikes
But here’s what matters: Claude asked “Is this OLTP or analytics? What’s your write/read ratio? Bulk inserts or single-row?” The recommendations changed based on my answers.
That’s not a config generator. That’s a consultant.
Build Your Own: /perf-tune
/perf-tune
When I say /perf-tune [service], FIRST ask:
- Workload type: OLTP / OLAP / Streaming?
- Connection pattern: pooled or direct? peak count?
- Data profile: working set size, write/read ratio?
THEN analyze current configs against hardware and workload.
Output: | Parameter | Current | Recommended | Impact | Risk |
Include rollback script.
Phase 4: Architecture Build
Before: Read 47 blog posts. Watch 3 YouTube videos. Piece together configs from different Postgres versions. Debug for 2 weeks. Still not sure if it actually fails over correctly.
Now: Describe requirements (RPO, RTO, budget). Agent presents architecture options with tradeoffs. Generates complete implementation plan with verification checkpoints.
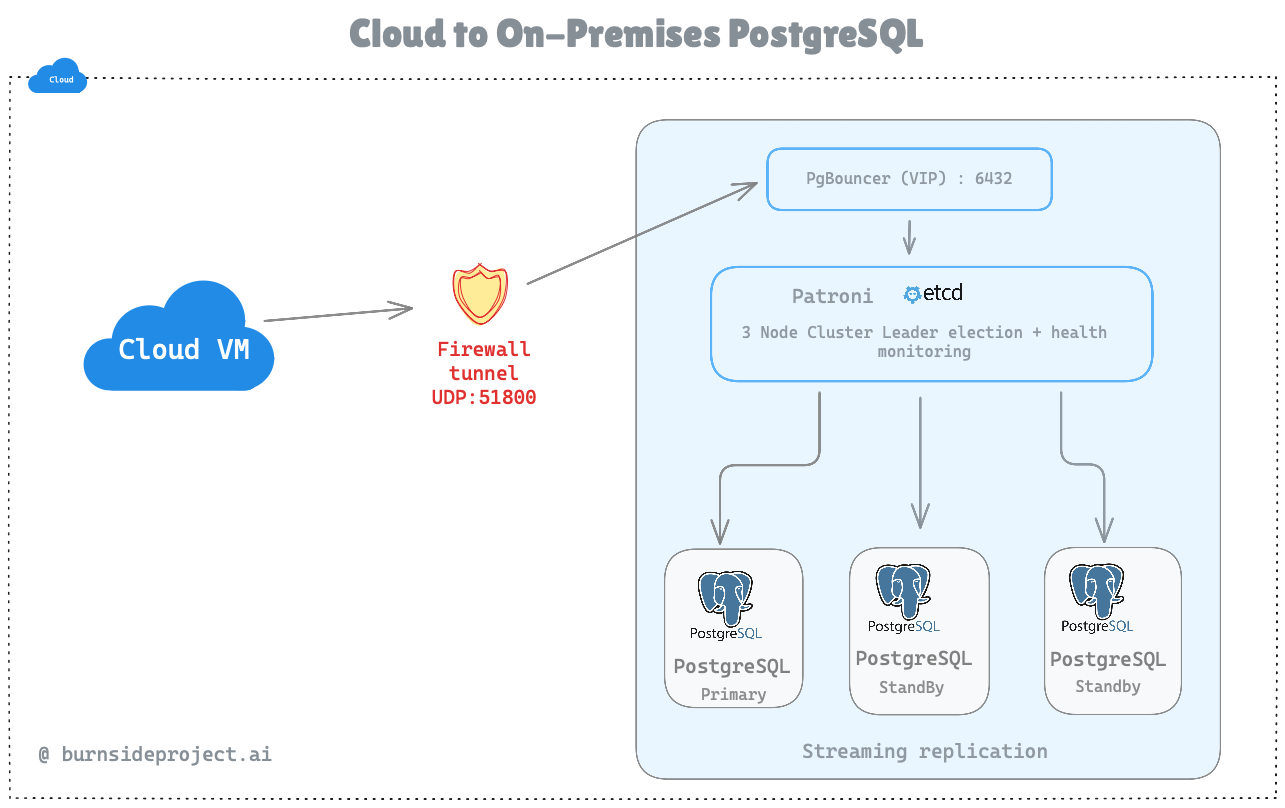
Verdict: Production-Ready Architecture
This diagram correctly represents:
Secure tunnel (no direct DB exposure)
Connection pooling (PgBouncer)
Automatic failover (Patroni + etcd quorum)
High availability (3 PostgreSQL nodes)
The implementation plan had phases with checkpoints:
Phase 1: etcd cluster → verify with etcdctl endpoint health
Phase 2: Primary + Patroni → verify with patronictl list
Phase 3: Standby node → verify replication lag <1 second
Phase 4: PgBouncer → verify connections route through pooler
Phase 5: Chaos test → verify survives primary kill
Each phase had rollback instructions. No “figure it out when it breaks.”
Build Your Own: /design-ha
/design-ha
When I say /design-ha [service], interview me:
- RPO: How much data loss acceptable? (zero / seconds / minutes)
- RTO: How fast must failover complete? (seconds / minutes / hours)
- Budget: Managed services OK or self-hosted only?
Present 2-3 architecture options with:
Cost / Complexity / Failover time / Data loss risk
For chosen option, generate phased implementation plan with verification checkpoints and rollback procedures.
Phase 5: Chaos Testing
Before: “We tested failover once in staging three months ago. It worked. Probably still works.”
Now: Continuous chaos testing. Kill primary every hour. Verify promotion. Confirm zero data loss. Automatically.
while true; do
# Insert marker record
# Kill primary mid-transaction
# Verify standby promoted
# Confirm marker record exists (zero data loss)
# Restore old primary as standby
# Sleep 1 hour, repeat
done
Results after 72 hours:
70+ automated failovers
0 data loss events
Average failover time: 12 seconds
Longest failover: 28 seconds (during heavy write load)
That’s confidence no SLA page can give you.
Build Your Own: /chaos-test
/chaos-test
When I say /chaos-test [service] [scenario], run:
- Pre-flight: Health check, insert data integrity marker
- Inject: Execute failure scenario (primary-kill, network-partition, disk-full)
- Validate: Service recovery time, data integrity check, alerts fired
- Cleanup: Restore failed component, resync, return to steady state
Support --continuous --interval=1h for ongoing validation.
The Math
Before (Managed PostgreSQL HA): $500-800/month
Now (Self-hosted with AI assistance): $80/month + 12 hours of my time
Key Takeaways
Developers can own more of the stack No waiting for the DBA team. No Jira ticket ping-pong. No “blocked on infrastructure.”
Build reusable agents, not one-off prompts The /infra-audit, /security-scan, /perf-tune, /design-ha, /chaos-test commands work for Kafka, Redis, any stateful service. Tooling that compounds.
The build vs buy equation has flipped AI compresses the learning curve from months to hours. Catches mistakes you’d ship to production. Asks questions you didn’t know to ask.
Most importantly:
Small teams can punch above their weight.
The barrier to entry drops dramatically.
You don’t need a dedicated DBA, SRE, and security engineer. You need curiosity, an AI partner, and the willingness to learn.
Connect:LinkedIn
Company: Burnside Project
Website: burnsideproject.ai
Written by data engineering
Senior engineer with expertise in machine learning. Passionate about building scalable systems and sharing knowledge with the engineering community.
Related Articles
Continue reading about machine learning

The Silent Cold Start Problem in Predictive Engines
Every ML-powered monitoring tool faces the same uncomfortable question on day one: How do you predict failures you’ve never seen?

Real-Time Shopping Recommendations in 150ms: Building a Modern E-Commerce Discovery Engine
How we built a production-grade product recommendation system that turns natural language into personalized product bundles faster than you can blink.
Stay Ahead of the Curve
Get weekly notes on PostgreSQL products and AI-agent consulting
Join engineers evaluating open PostgreSQL workflows